

The figures below are the interactive versions of the figures in the article, in the article’s order and under the article’s numbers. Hover a series for its values, drag across a chart to zoom and double-click to reset, and click a legend entry to hide or isolate a series.
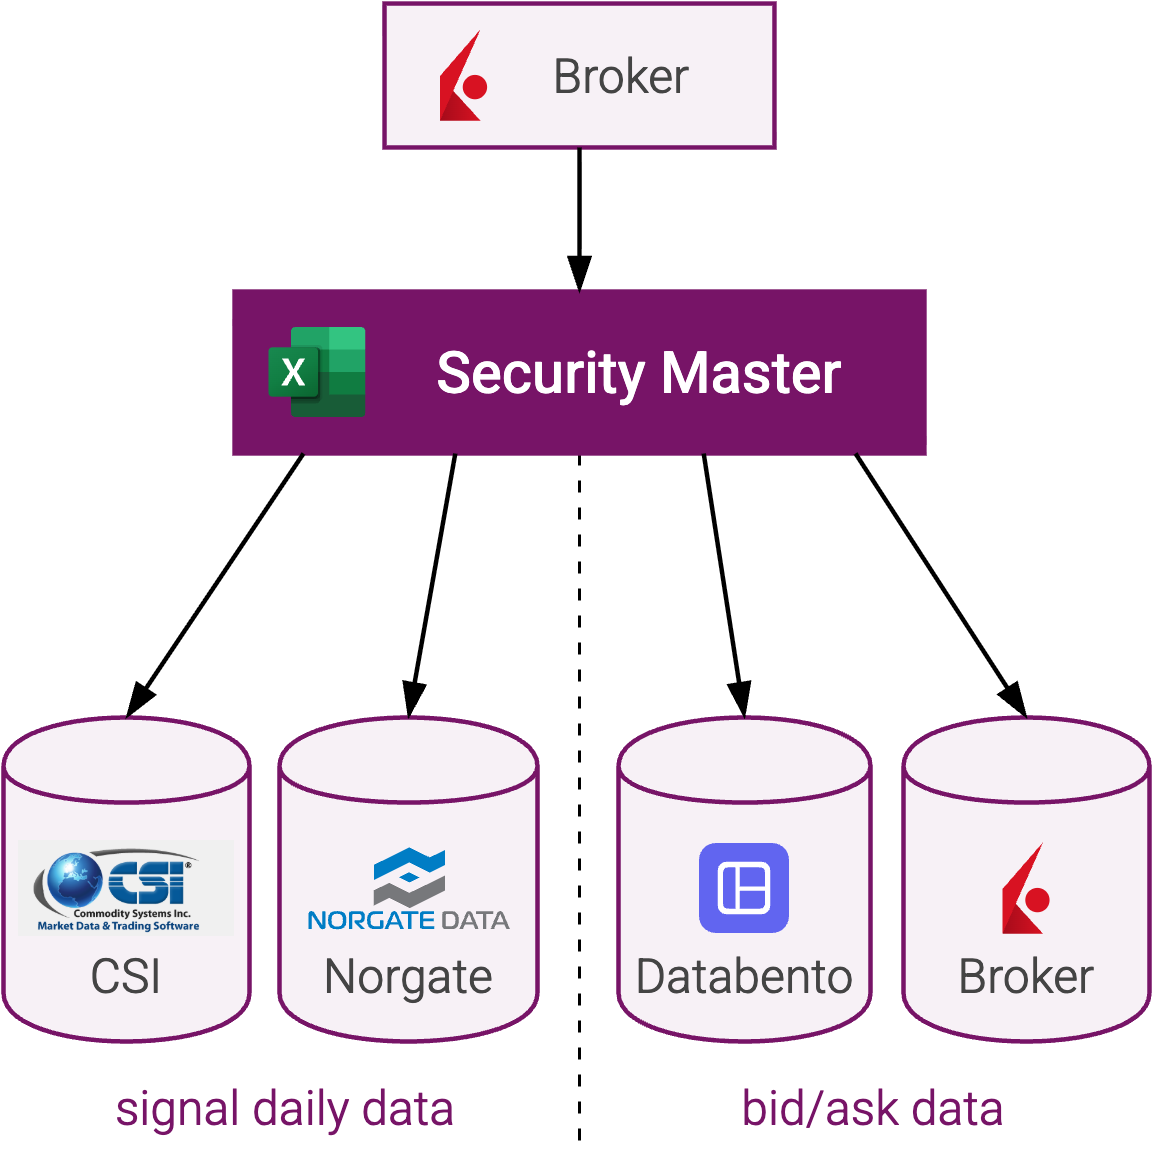
Figure 1. The security master connects broker instruments to signal and cost data.
Note: CSI and Norgate supply daily price histories; Databento and Interactive Brokers supply bid/ask quotes for estimating spread costs.
Figure 2. Of 684 workbook entries, 301 pass the static filters and represent 243 distinct markets.
Note: October 2026 snapshot. Each entry is removed at its first applicable filter. Retired and backfill histories remain available for backtests. The final bar groups the remaining contract-size variants; daily tradability checks still apply.
Figure 3. Examples of backfilled histories.
Note: October 2026 snapshot of stored daily closes. Bars show the extended histories, sometimes by decades.
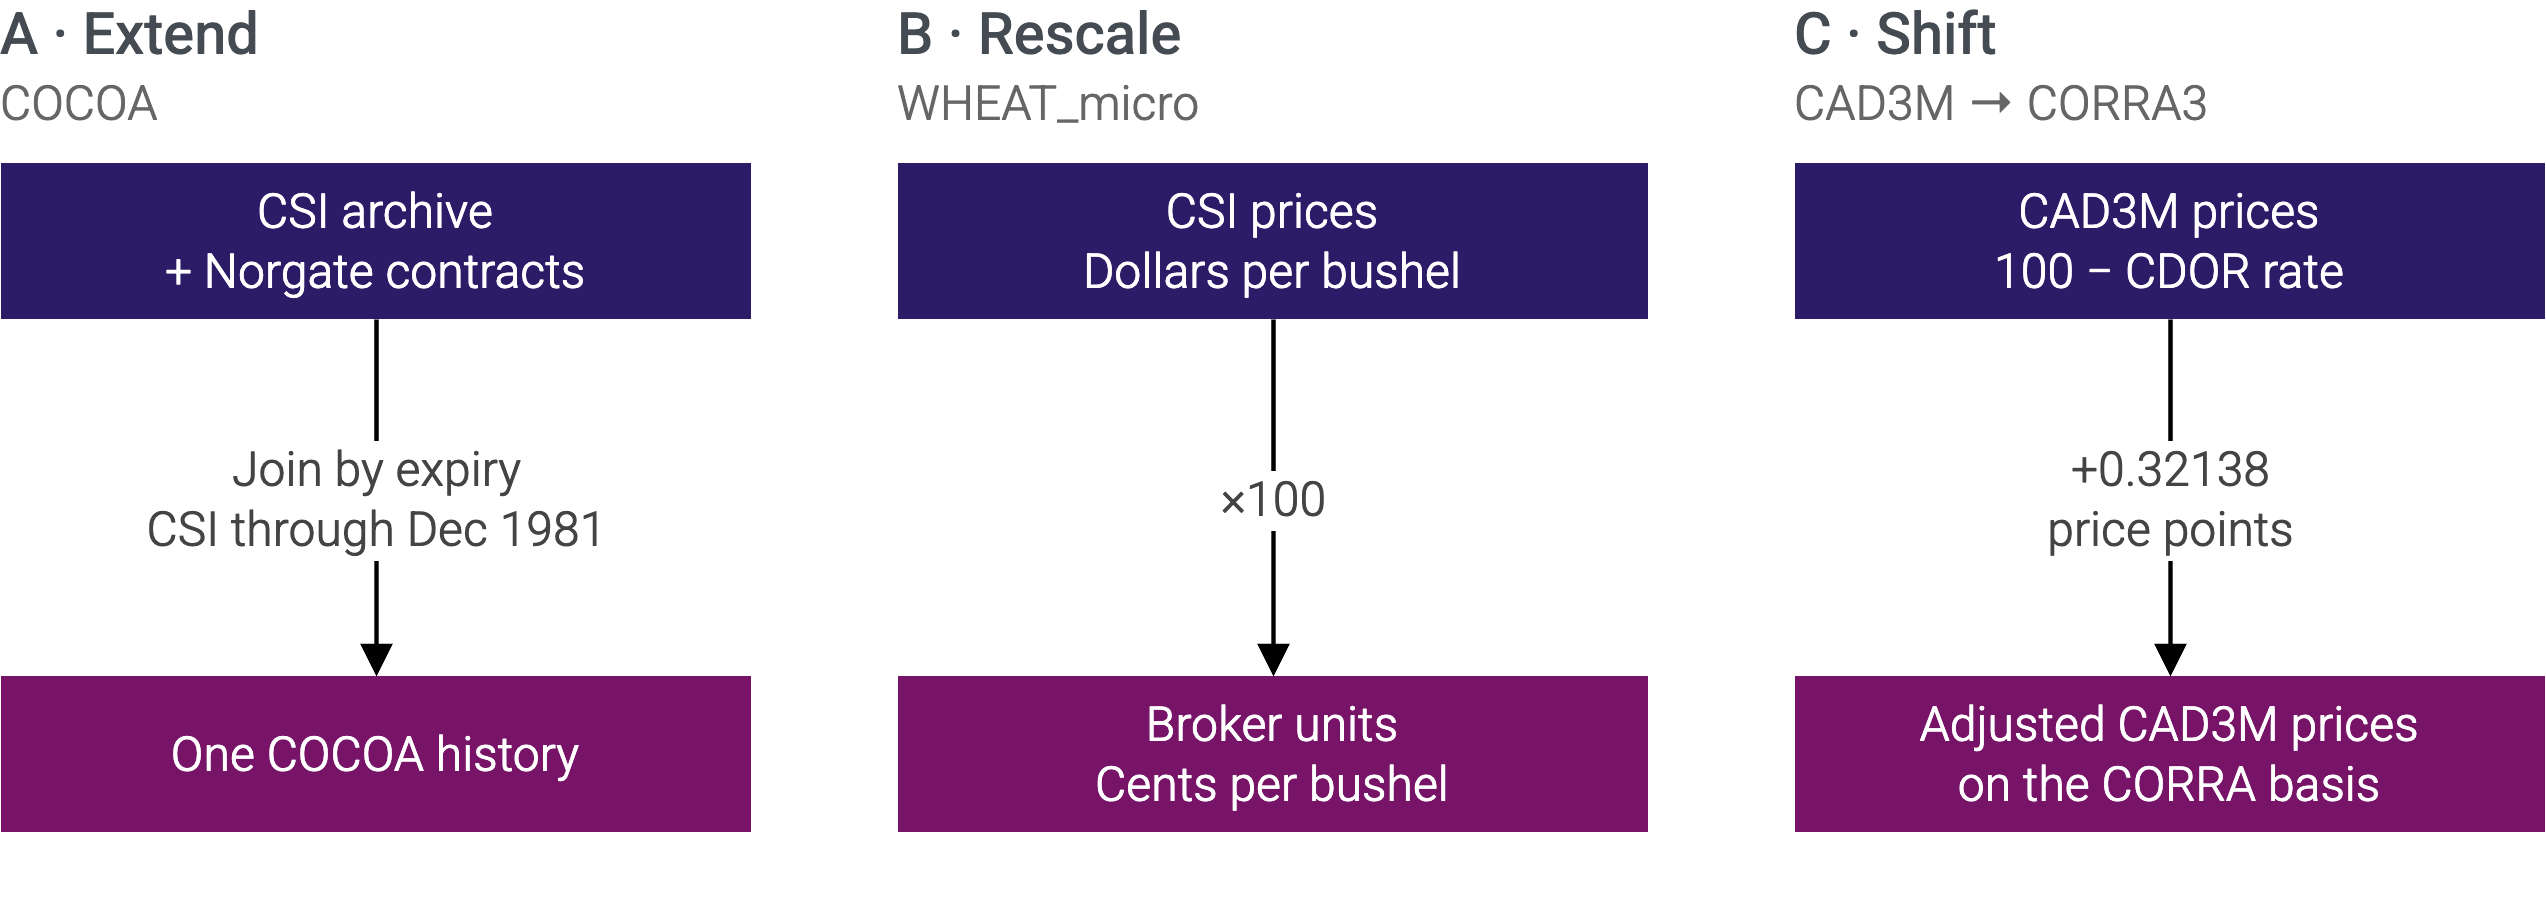
Figure 4. Three examples of backfilling. Some histories only need an extension, others a little arithmetic.
Note: A joins contracts by expiry, the price histories can overlap in calendar time. B scales dollars to cents. C adds 0.32138 to CAD3M prices before joining them to CORRA3.
Figure 5. The futures retirement home still has plenty of stories to tell.
Note: October 2026 snapshot of 55 retained histories, including associated backfills. Read down the left panel, then the right. Dots mark the first and last stored daily close; connecting lines show the span, which may contain gaps. Retirement includes loss of broker or provider access, not just exchange delisting.
Figure 6. Retired contracts add observations where history is thin.
Note: October 2026 snapshot. Counts cover all 55 instruments in Figure 5 with at least one data point during the year.
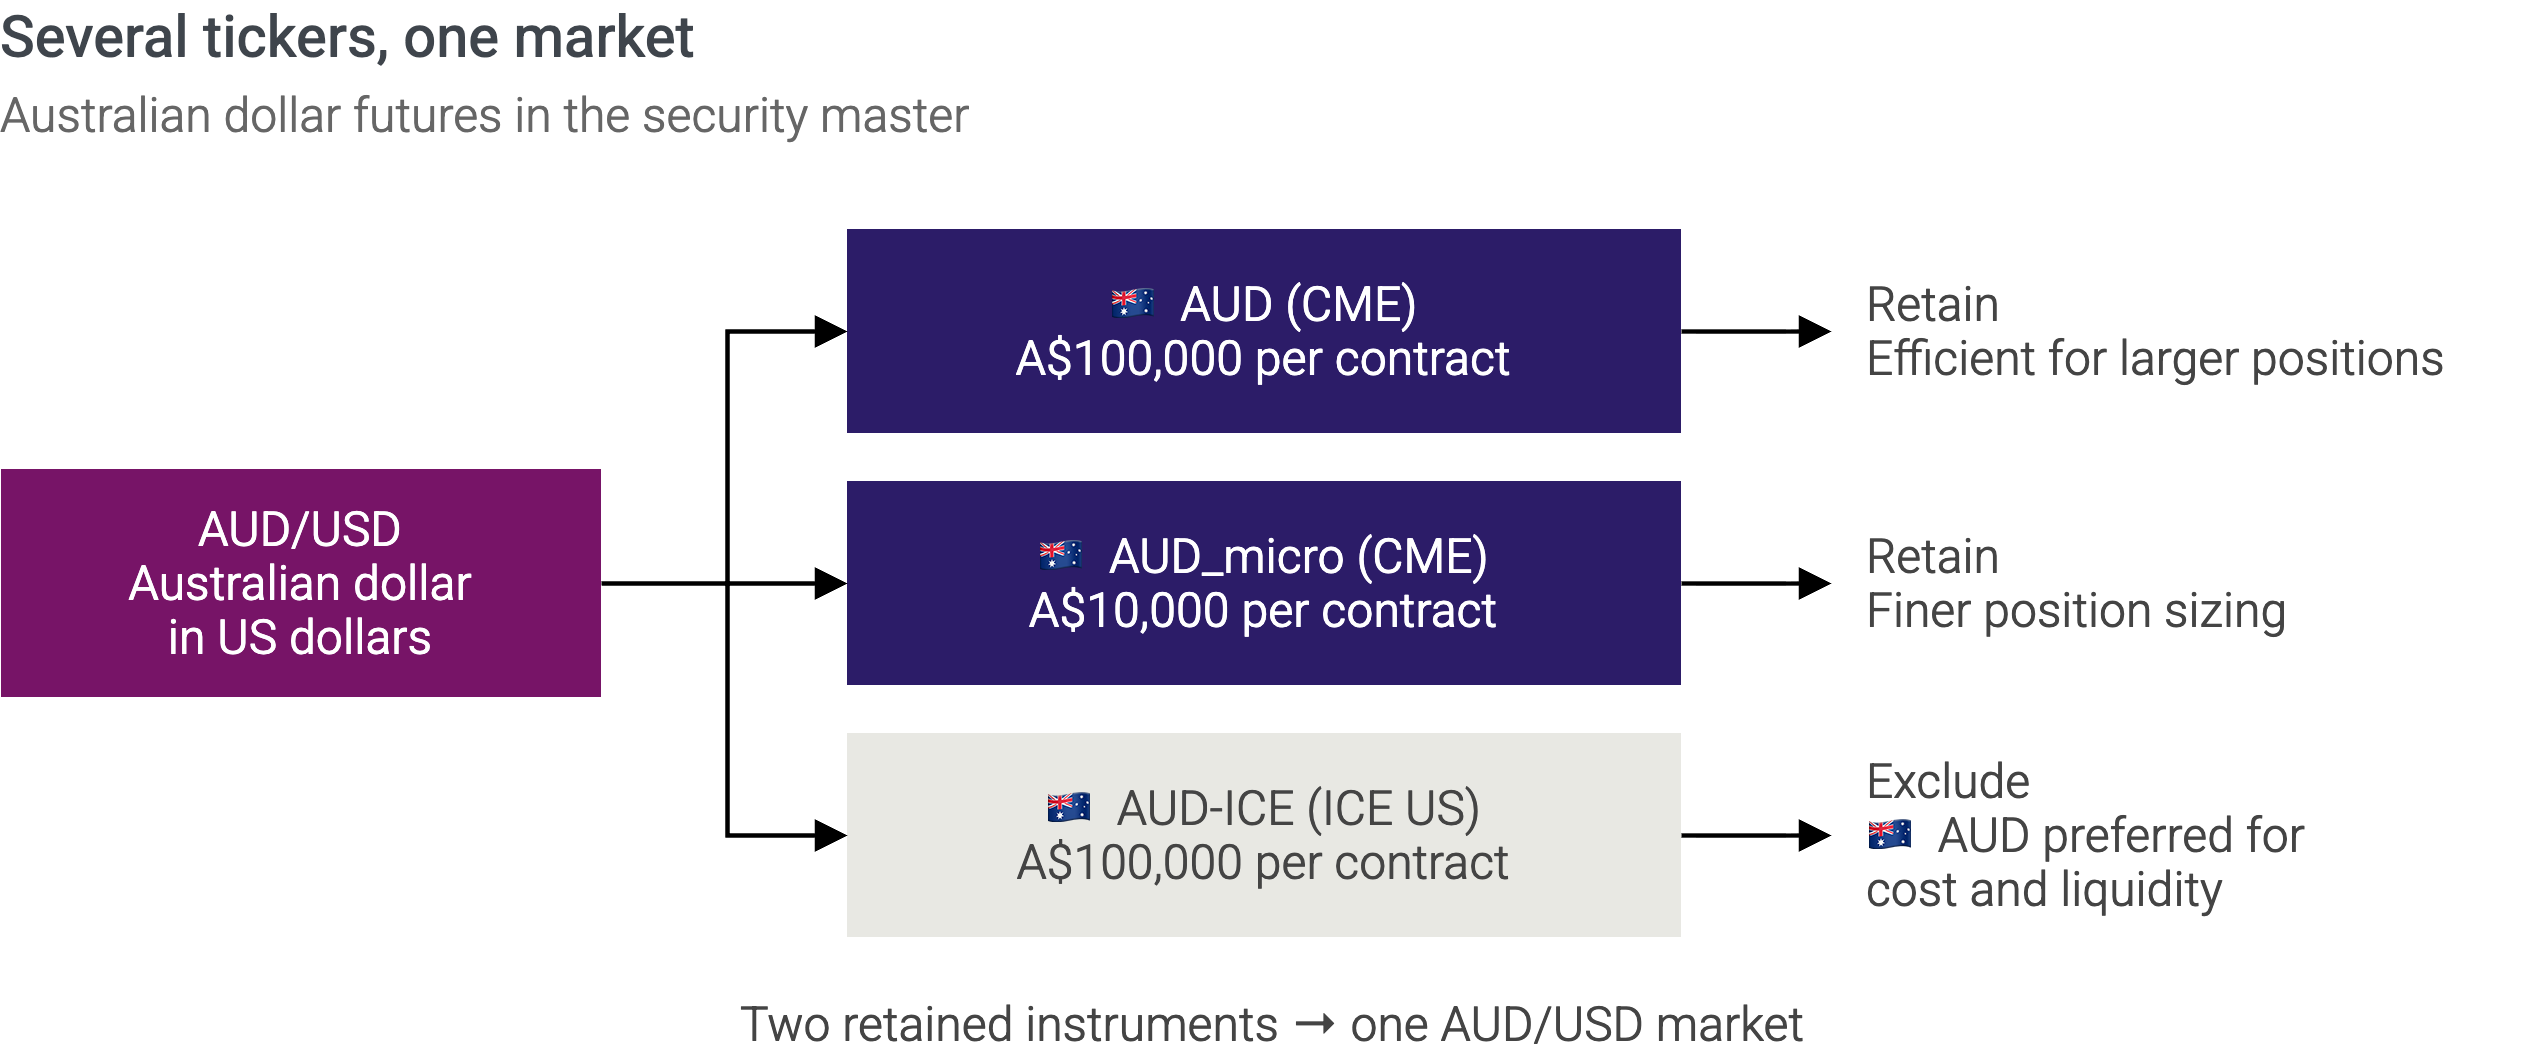
Figure 7. Similar prices, different jobs: an instrument earns its place through execution.
Note: Selected AUD/USD entries from the October 2026 security master. Labels use the Instrument names. Sizes, retention and the exclusion reason come from Multiplier, Blacklist and Comment. A$ denotes Australian dollars. The retained instruments share market exposure but need not have identical prices.
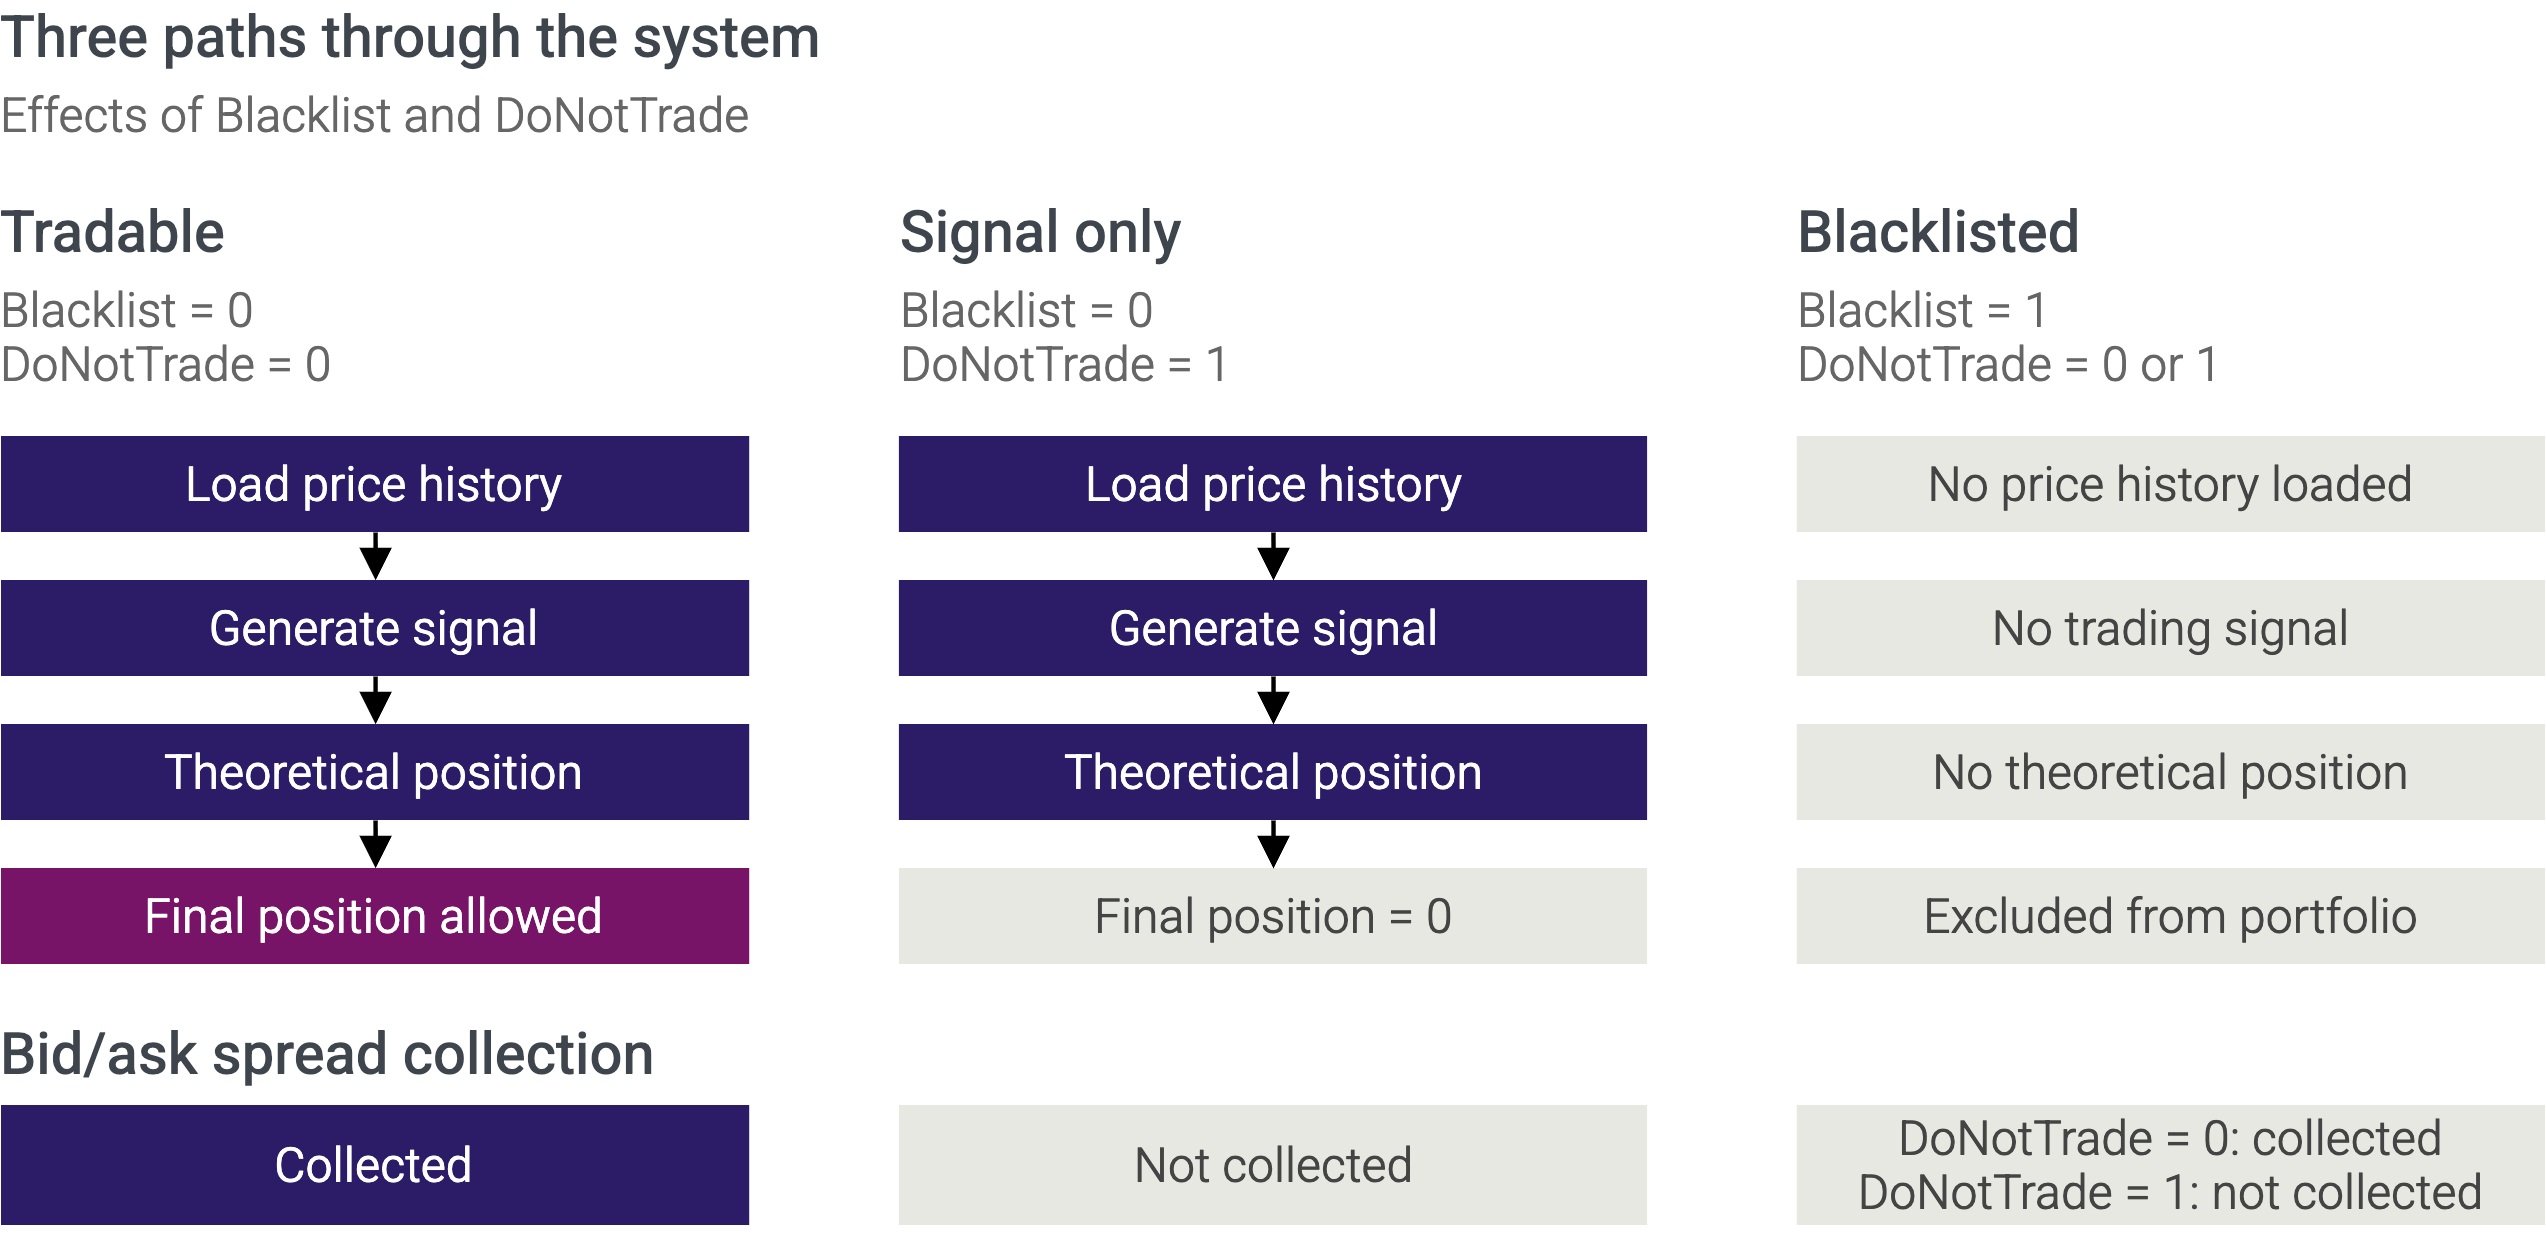
Figure 8. An instrument can remain part of the model even when it is excluded from trading.
Note: Blacklist stops price-history loading and signal generation. For an instrument that is not blacklisted, DoNotTrade allows both steps to continue but forces the final position to zero. DoNotTrade also stops spread collection because the broker rejects market data requests.

Figure 9. Detecting a trading restriction does not automatically change the security master.
Note: In this example, the broker blocks opening trades and the system stores that status. The DoNotTrade flag is then manually set to 1 in the workbook.
Figure 10. Being kept in the dataset does not mean being available to the portfolio every day.
Note: Daily observations, January 2021–13 October 2026. Volume is the currently traded expiration’s individual volume, averaged over 20 trading days. Dashed lines mark the thresholds, which must both be exceeded. In the bottom panel, 1 means tradable and 0 means excluded.
Figure 11. Smaller contracts and lower dollar fees do not necessarily mean lower costs.
Note: Snapshot October 2026. The bars show the one-way cost burden for scheduled rolls, as a percentage of annualised contract risk. They do not include strategy turnover. AEX Mini uses full-size AEX market data with its own contract configuration. The dashed line marks the 10% ceiling.
Figure 12. Five Friday expiries walk into one month-based identifier.
Note: Schematic using October 2026. GAS-US-WEEKLY expires every Friday. A year-and-month key maps all five contracts to 2026-10.
Figure 13. The tradable universe expanded at different speeds across asset classes.
Note: March 1975–October 2026. Lines show the 150-day average number of instruments passing both the filters in Figure 2 and the daily IsTradable checks. In October 2026, 278 instruments passed: 123 equity, 37 rates, 37 FX, 36 agriculture, 23 metals, 19 energy, and 3 volatility.
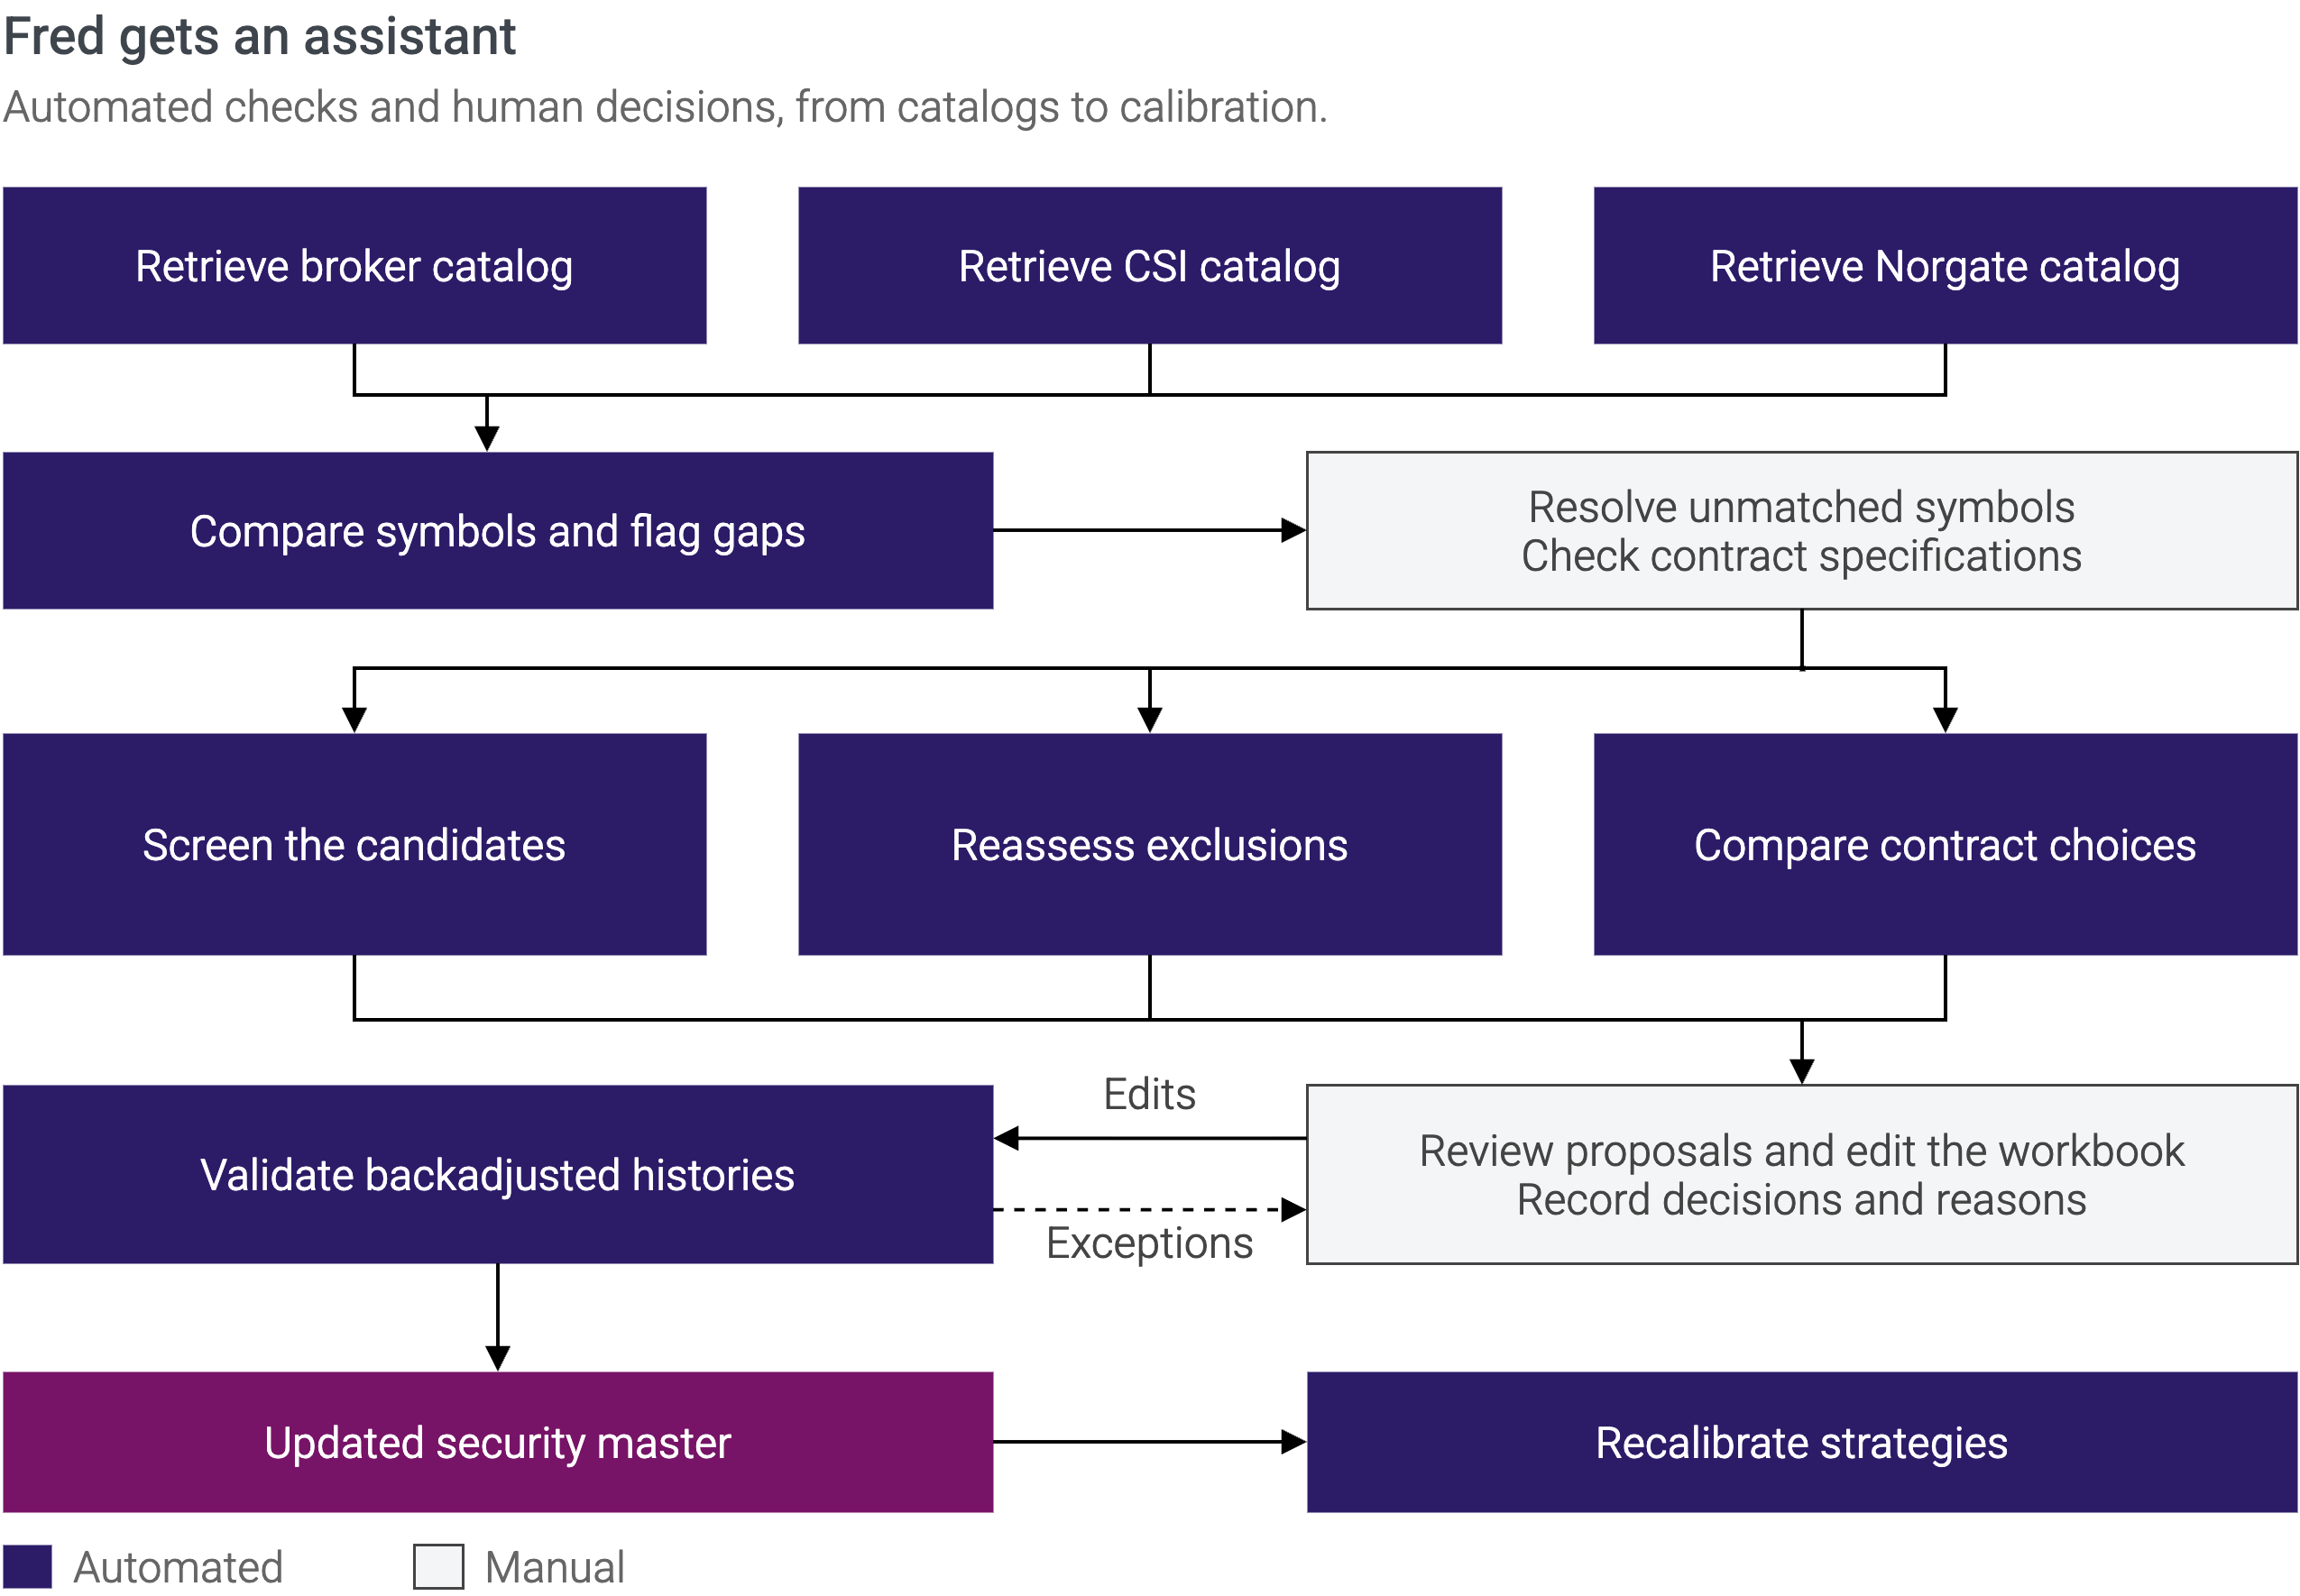
Figure 14. From three catalogs to an updated universe and recalibrated strategies.
Note: Approved edits feed the data rebuild; failed checks return to review.
Full textRead the complete article online · Figures omitted
Letter from the editor
If I want my automated trading system to start trading something new—cocoa, for example—I begin with one row in a spreadsheet. Getting that row right can swallow an entire week.
The past five weeks have been full of this kind of work. Once a year, I review and update my trading system’s futures universe. This year, I got the order a little mixed up: I recalibrated the strategies first, as described in my last article. That work followed the methodology improvements introduced in Crafting a Trading Strategy.
Research has a habit of disrupting established routines. Updating the universe after calibration meant recalibrating the strategies again. The extra work did have a benefit: it gave me more confidence in the new calibration procedure. It handled the expanded trading universe as intended, without requiring further changes to the methodology.
The annual update also prompted automation to support my decisions. Automatically extracting the broker’s available futures saves me working through its catalog by hand and helps me decide which markets to investigate. My annual spreadsheet update had quietly become a software project.
Those tools helped gather the answers, but I still had to check them. Contract details and price histories needed a closer look, and every exception needed documenting. Do enough of this and you start to sound like your Uncle Fred at the German tax office: “that’s probably right” means the paperwork is coming straight back. This article is about that work. And about your inner Fred.
The Question
What belongs in a futures security master, and how do you keep it reliable?
Behind the scenes
Instrument definitions, delistings, conflicting data sources, changing multipliers, broken histories—and the checks a new market must pass before joining the portfolio.
The takeaway
A security master records the decisions and assumptions your entire trading system depends on. Getting those details right is an ongoing job.
- 301 instruments
- 51 years of data
- 4 data providers
A futures security master tells the trading system what each instrument is, how to interpret its prices, and whether it may be traded. These definitions connect historical research to live execution.
A market’s symbol is only part of its identity. The system also needs the contract size, price units and delivery month. Get those details wrong and a sound trading rule can produce a position you never intended to take.
The data universe and the trading universe serve different purposes. A full-size contract may supply history for a smaller contract, while a delisted future can remain useful in historical backtests. The security master records those relationships.
Before adding an instrument, we therefore need to settle two questions: can we trade it, and which data should represent it?
Data sources
Connecting tradable markets to the right data.
It is easier to explain a security master with a real one in front of you. You can download mine here. Yes, it is an Excel workbook. I realize you may have expected something more sophisticated.
In 20 years as a quant, I have yet to visit a financial institution that did not use Excel. Apparently, success in finance requires at least one spreadsheet. That’s why my trading system uses one.
In practice, Excel gives me a convenient way to edit the configuration. The trading system reads the workbook and validates its contents before using them. Excel is the interface. The checks live in the code.
Before filling in the rows, though, we need to establish which contracts belong there.
For live trading, the broker sets the first constraint: it must offer the contract and allow your account to trade it. A product can appear in its catalog and still be unavailable to you, for example because of restrictions in your jurisdiction.
I use Interactive Brokers for execution, so its futures catalog is my starting point. The workbook’s IBSymbol column records the broker’s symbol for each instrument.
Exchanges and data providers have their own naming schemes. To keep track of the same market across them, I give each instrument a memorable name and an icon, such as 🐷 LEANHOG.
The pair appears on dashboards, in logs and throughout the system’s other output. A pig is easier to spot than another cryptic contract code.
As a systematic retail trader, you are also the main user of your own software. Make life easy for the person reading its logs at the end of a long day. That person is usually you.
Once an instrument has a place in the workbook, it needs data. Figure 1 shows how the security master connects the broker’s instrument definitions to two kinds of input: daily prices for generating signals and bid/ask quotes for estimating spread costs. The jobs are different, even when one provider supplies both.
I pay for dedicated data mainly to save time, even where the broker could supply it. I collect and store some histories myself, such as stock borrow rebate rates, but avoid taking on another data-maintenance job unless I need to.
Formats change, histories need to remain consistent, and backups need looking after. Downloading the prices is the easy part.
Broker data is not necessarily free either: exchange subscriptions can add up. I therefore weigh the subscription bill against the work of collecting and maintaining the history.
Signal data
The current strategies generate signals from daily prices for futures (ContractType column). Handling stocks and ETFs is already supported but will be the topic of another article.
The system stitches histories for individual futures contracts into back-adjusted series for signal calculations and backtests.
CSI and Norgate together cover more markets than either provides on its own. Both have provided excellent support and corrected data after I reported inconsistencies. That is a good reason to build your own quality checks, even when you are paying someone else to do theirs.
The Provider column selects the extractor used to load an instrument’s daily data. One provider may have several extractors, such as Norgate and Norgate-Delisted. The latter runs only when rebuilding the history from scratch.
Delisted markets have no new daily prices, so their histories can sit out the daily download.
The ProviderSymbol column records the instrument’s symbol at the selected provider. When historical data is unavailable, it contains NA and the missing coverage is documented in Comment. That makes the gap explicit rather than leaving an empty cell for the reader, or the code, to interpret. StartDate records the date the system has historic data for an instrument.
Bid/ask data
Bid and ask quotes allow the system to estimate spread costs and measure slippage by comparing execution prices with the quotes prevailing immediately before order placement.
While delayed bid/ask data at relatively coarse intervals is usually available free of charge from the broker, real-time feeds generally require a paid subscription.
To keep costs down, I estimate spread costs using free broker data wherever possible. To measure slippage in live trading, I use real-time feeds from exchanges with affordable subscriptions. For exchanges with more expensive real-time feeds, such as CME and ICE, I use Databento instead.
Databento provides historical trade and quote data. I use the recorded order-placement timestamp to retrieve the bid and ask quotes immediately before submission, then compare them with the execution price.
The IntradayProvider column specifies the provider used to measure slippage, while IntradayIdentifier identifies the instrument at that provider.
For exchanges that do not have a configured provider, spread costs can only be estimated using delayed data.
If you are starting out, you do not need a dedicated quote-data feed. An initial spread estimate can also be obtained from observing quotes in your broker’s trading platform. With a handful of markets, that is manageable. Across a large universe, you have quietly acquired a second job.
Key Takeaways
Balance coverage, subscription costs and maintenance. Paid data still needs quality checks.
Daily prices drive signals and backtests while bid/ask quotes measure spreads and slippage.
Building the universe
Building reliable histories, selecting tradable markets, and getting the contract details right.
A row in the workbook is not a promise to trade. Some rows preserve old price histories. Others record markets that failed an earlier check.
This is where Uncle Fred pulls up a chair and reaches for his stamp. Is the price history usable? Will the broker accept the order? Is there enough liquidity, and how much will it cost to trade?
“It looked good in the backtest” is unlikely to get the application approved.
His filing habits are useful here. Keeping excluded markets in the workbook preserves the reason for each decision. Otherwise, the same attractive contract can turn up at the next annual review, ready to waste another afternoon. The Comment column is where Fred leaves his objections for future reference. A new data feed or better liquidity may change the verdict, but there should be a reason for reopening the file.
Figure 2 shows how these checks narrow the list. Each entry is counted under the first applicable filter, even if several reasons would rule it out.
The chart is a snapshot, not a permanent verdict. Costs and liquidity change, and broker access can disappear even when an exchange still lists the contract. An instrument that passes these checks is eligible for trading. Signal strength, available capital and portfolio construction determine whether it reaches the book.
The following sections walk through the selection process step by step, skipping those that are self-explanatory.
Piecing together the past
The “backfill” step uses rows from the spreadsheet to supply the price history for another instrument. They remain useful for backtesting, but do not represent additional instruments to trade.
Take 🍫️COCOA: the CSI history used here starts in June 1975, while the stored Norgate history begins in December 1979. Combining them adds about four and a half years without requiring ongoing downloads from both providers.
My CSI subscription allows 150 markets to be updated at a time, so each slot is valuable. The older CSI prices are downloaded once, archived under 🍫️COCOA_backfill, and read by the CSI-Delisted extractor. That frees the CSI slot while Norgate supplies new data for COCOA.
The same approach works across contract sizes. The history of 🇺🇸SP500_micro, for example, is extended with data from the larger E‑mini contract, 🇺🇸SP500. That history is extended in turn with the original full-size contract, 🇺🇸SP500ORG. The chain reaches back to 1982.
Sometimes the larger contract represents the entire history: 🇨🇦TSE60_mini uses the standard contract’s data because the providers do not cover the smaller version. These cases are marked “uses full size data” in the Comment column and are only possible if small-size variants of the contract are always liquid enough.
Where the smaller contract is sufficiently liquid, using the larger contract’s data can also save a provider slot, as with 🌽️CORN-W_micro. Figure 3 shows how much history this recovers in three examples.
“Wait a minute,” you might say. “The S&P 500 Micro did not exist in 1982. How can it appear in a backtest that goes back that far?”
For the years before the Micro existed, the backtest uses the older S&P 500 contract’s price history and calculates positions using the Micro’s smaller contract size. This reconstructs how a smaller position would have behaved over that period.
The full-size, E‑mini and Micro contracts therefore have very similar histories. My system groups them when allocating risk, so adding another contract size does not automatically give the S&P 500 more weight in the portfolio. Smaller contracts still serve a purpose: they allow positions to be adjusted in smaller steps.
I will return to the details of risk allocation in a separate article on portfolio construction.
Recovering the history of instruments is only half the job. The contracts need a clear handover, and their prices need to speak the same language.
Figure 4 shows three ways of combining price histories.
For COCOA, the backfill InactiveContract is the December 1981 contract taken from CSI. Later contracts come from Norgate. The handover follows contract expiry rather than a single calendar-date cutoff across all price series.
Price conventions also need to agree. CSI quotes 🌾WHEAT_micro in dollars, while the broker quotes it in cents. Therefore, its prices are multiplied by 100 before they are combined with the older wheat contracts.
Other migrations need a fixed offset. After the market closed on April 26, 2024, Montréal Exchange converted the outstanding BAX contracts expiring after June 2024 into three-month CORRA futures1. In the workbook, these are 🇨🇦CAD3M and 🇨🇦CORRA3. The conversion spread was 32.138 basis points. Because these futures are quoted as 100 minus the interest rate, putting the old BAX prices on the CORRA basis requires adding 0.32138 price points. The backfill applies that adjustment to the predecessor contracts before joining the histories.
If you are now tempted to abandon futures trading altogether, I sympathize. You can lose months untangling this mess before you have tested a single trading idea. With equities, at least a good data provider takes the burden of splits and other corporate actions off your shoulders. Norgate does this well.
And just when the histories seem complete, currencies add another complication. The backtest needs exchange-rate histories to express non-dollar positions and profits in US dollars. Some price histories, like 🇫🇷️CAC, use euros even for years before the euro existed.
To cover those years, I had to reconstruct a euro proxy from the historical currency basket behind the European Currency Unit (ECU).
Adding a futures market takes one row in a spreadsheet. Getting that row right can swallow an entire week.
Gone, but still in the backtest
An instrument can leave today’s trading universe and still be part of the backtest. Building a backtest strictly from today’s survivors is problematic, as is easy to see in equities: omit the companies that went bankrupt, and some expensive mistakes disappear from the backtest. That is called survivorship bias, and keeping delisted instruments helps address it. The security master must therefore record both what can be traded today and what was available to the strategy in each earlier period.
Retired markets also add data where it is most welcome: in the early years, when far fewer instruments existed. Keeping them broadens the set of markets available in those years and lets a strategy face more market conditions. Related markets still share risks, so every extra instrument is not an independent time series, but the broader sample makes the backtest more representative.
Futures markets can disappear for different reasons. Hedging needs change, liquidity dries up, or a replacement contract attracts more business. The commodity itself need not have become worthless. Take 🐖PORKBELLIES, which had their moment of Hollywood fame in Trading Places (1983)2. CME delisted frozen pork belly futures in July 20113 after a prolonged lack of trading volume. Bacon had not gone out of fashion, but trading that particular futures contract had.
Uncle Fred therefore stamps the file “Retired” and puts it back in the cabinet. The trades it generated, including the bad ones, still belong in the backtest. Fred may enjoy a tidy desk, but that is no excuse to put the losers through the shredder.
A more recent example comes from my broker. Interactive Brokers will stop trading its London Metal Exchange lookalikes in November 2026. These are over-the-counter contracts that reference LME futures4, giving access to metals such as aluminum, copper and tin. The underlying LME markets continue to exist, but this route to trading them is closing. Their histories remain useful even after they leave the live universe. Here, “retired” describes their status in the system. It does not mean the exchange has delisted the underlying market.
The InactiveContract column records where the retained contract history ends. It contains a contract identifier, rather than a calendar date. For 🟠️COPPER-LME, for example, 1763CAM-2026M identifies the June 2026 contract. Later contracts are excluded when building the history, and an instrument with this field filled in is omitted from the live configuration. That June cutoff is separate from IB’s November withdrawal. The final simulated trade also depends on the roll schedule and the data it needs.
The same column serves two purposes. A backfill entry supplies older contracts to another instrument, as in the cocoa example above. A retired instrument keeps its own historical identity and can remain in the backtest.
Figure 5 shows the 55 retired instruments with stored price histories. The retirement cabinet holds rather more than a few curiosities.
Figure 6 counts the histories available in each year. Together, these retired instruments contribute ten histories in 1980 and 27 in 1990, reaching a peak of 39. The retirement cabinet is doing useful work long before many of today’s contracts enter the picture.
Keeping a delisted instrument does not automatically make it eligible every day in the historic backtest: The instrument still needs usable data and enough liquidity during the period being tested. The aim is to include markets that could realistically have been traded then, with the information available then.
One market, several contracts
Uncle Fred has barely put his stamp down when the Australian dollar returns to his desk wearing a different exchange badge.
“New ticker” it announces. “More diversification”. Fred looks over his glasses. “I have three stamps that say ‘Rejected’. That doesn’t make them three independent instruments.”
The same exposure can come in several contract sizes or trade on competing exchanges. The workbook excludes 🇦🇺AUD-ICE in favor of AUD, for example, and 🇪🇺ESTR-CME in favor of ESTR. In both cases, the Comment column documents a cheaper, more liquid alternative. Fred points to it with the expression of a man who suspects you have come all this way without reading the form.
Each candidate still deserves a proper examination. Whether two contracts count as duplicates is a case-by-case decision. I treat 🍫COCOA-LDN and COCOA as distinct markets: London cocoa is priced in sterling for delivery in Europe, while New York cocoa is priced in US dollars for delivery in the US5. Currency movements and local supply-and-demand conditions can therefore drive their prices apart. Even Fred accepts that “both involve chocolate” is an inadequate basis for a rejection.
For the backtest, another highly correlated instrument may add no diversification at all. Photocopying the same witness statement does not give you ten witnesses. Counting each version as a separate market can also give the underlying exposure more weight simply because an exchange offers another way to package it. Ten wrappers around the same market do not make a diversified portfolio.
The additional contract also needs a useful job. If the preferred contract provides the desired exposure more cheaply and with better liquidity, its rival may never reach the portfolio. Fred compares costs for equivalent exposure. A lower commission per contract is less impressive when you need ten of them. The Blacklist flag records the exclusion, and Comment explains the decision, saving the rejected applicant from returning next year with a fresh haircut and the same spread.
Then 🇦🇺AUD_micro arrives. Fred checks the contract size: A$10,000, against AUD’s A$100,000. “You appear to have lost a zero.” In this case, that is the point. A smaller contract allows finer position sizing when positions must be rounded to whole contracts, especially in a smaller account. The S&P 500 variants discussed earlier serve the same purpose. Fred puts down the rejection stamp. “Approved. But your larger relative has already claimed the diversification allowance.”
Correlation weighting prevents retained variants from each receiving the allocation of an independent market. Portfolio construction then decides how to express the exposure. High correlation alone therefore does not settle the application: the “highly correlated” step in Figure 2 removes alternatives that offer no compelling execution advantage, while the final “unique markets” bar groups the retained size variants.
Figure 7 shows the verdict for one example: keep the standard and micro contracts at CME, and exclude the ICE alternative. Three applications, two approvals, one AUD/USD market. Fred has earned a biscuit. He breaks it in half and briefly considers recording two.
Broker access
Fred has approved the paperwork. Unfortunately, the broker has its own rejection stamp, and unlike Fred, it does not stop working at five.
An instrument can have a useful price history and still be unavailable to trade. The DoNotTrade column lets me keep that distinction in the system. With the flag set to 1, an instrument will still generate a trading signal and receive a theoretical position in the optimal portfolio, where fractional contracts are allowed. During portfolio construction, however, its position limit is set to zero. It may contribute information, but the resulting portfolio holds no contracts in it.
This assumes the instrument is not blacklisted. With Blacklist set to 1, its price history is not loaded and no trading signal is generated. The system still checks its bid/ask spreads if DoNotTrade is 0. Figure 8 compares these paths through the system.
I typically refrain from having too many instruments in the universe that generate signals but are not tradable because several experiments have shown that when an instrument generates a signal but is not tradable, the final portfolio does not improve.
Some tradability restrictions arise from regulation. The workbook flags some US sector futures such as 💻US-TECH because of restrictions associated with section 871(m) of the US tax code with regard to non-US investors6.
Other obstacles are more mundane. The broker may not support the product for the account, or may not make it available for margin trading. Restrictions can also be temporary. The broker may temporarily block trades that open or increase a position. The market can remain open, with prices arriving normally, while my route into it is blocked. DoNotTrade is a blunt control: it imposes a zero position limit rather than representing every variation of those rules. The Comment column records the reason, and a temporary restriction needs revisiting when the broker changes its policy.
Therefore, broker access is an ongoing maintenance job. Figure 9 shows the current process: the system automatically records whether the broker allows each instrument to be traded, but I update DoNotTrade manually in the security master. Once enough tradability history has accumulated, I plan to feed it automatically into the backtest, with the option of manual overrides.
Anyone on the other side?
Fred has the broker’s approval. He calls out, “Next, please.” Nothing happens. He tries again. For the first time in his career, the empty waiting room is a problem.
Markets with virtually no activity usually go on my Blacklist. Thinly traded markets can stay in the dataset because liquidity changes. The eligibility is reassessed each day within the system with its own flag IsTradable.
This daily liquidity check has two parts. Average daily volume over the previous 20 trading days must exceed 50 contracts. Risk volume must also exceed USD 100,000. This measure multiplies average contract volume by the contract’s value in US dollars and its estimated annualised volatility. The result puts differently sized contracts on a common risk scale.
Figure 10 illustrates these checks using 🇪🇺MSCIEU, an MSCI Europe equity-index future. It remains eligible throughout 2021, becomes intermittent as activity weakens, spends much of the second half of 2024 outside the tradable universe, and qualifies for most of 2025. In 2026, it moves in and out again as the two liquidity measures cross their thresholds.
IsTradable also checks minimum volatility and estimated holding costs. Those tests pass throughout this example. To avoid constantly switching eligibility on and off, a passing result is carried forward for up to 30 trading days. The flag can therefore remain 1 after liquidity falls below a threshold. An eligible instrument can thus be included in the live portfolio.
The market can qualify again when activity returns. At the end of the chart, both liquidity measures have slipped below their thresholds, but the flag remains 1 because the last passing observation is still inside the 30-day grace period. Fred approves of the daily review. An application that can be reopened every morning is practically a pension plan.
Cost configuration
Trading involves two main variable costs: broker commissions and bid–ask spreads.
These costs arise whenever a position is opened or closed, including when it is rolled from one contract expiry to the next. Depending on the rolling method, this may involve closing the existing position and opening a new one, or trading the calendar spread directly.
The timing and method of each roll can materially affect the trading system’s total costs. Automating this process properly is a topic in its own right.
In brief, PriceRollCycle defines the contracts used for each instrument, while HoldRollCycle specifies the expiries that the system may hold. RollOffsetDays sets how many trading days before expiry a roll may occur, while CarryOffset determines whether the system calculates an instrument’s carry using the next or the previous contract.
The workbook also specifies a SpreadCost for each instrument. Expressed in the contract currency, this value represents half of the instrument’s typical bid–ask spread. The system uses it as an initial estimate when reliable historical spread data are not yet available. Once enough observations and actual fills have been collected to estimate the spread cost, the field is no longer used.
You may have noticed that the workbook does not specify broker fees for each instrument. My system retrieves the current commission from the broker automatically and maintains a history of each instrument’s fees.
Figure 11 applies the daily cost filter to five live instruments and the blacklisted AEX Mini. For each instrument, it adds the one-way commission to the estimated half-spread, divides that cost by the current annualised risk of one contract, and then multiplies the result by the number of scheduled rolls per year. This common scale reveals what dollar fees can hide: the Nasdaq Nano has a lower dollar fee than its larger relatives, but a much higher cost relative to the risk it carries. Similarly, monthly rolls can push an apparently modest trading cost above the screening threshold.
As Figure 11 shows, the AEX Mini exceeds the 10% ceiling and is therefore marked “too expensive” in the workbook. Passing this cost screen does not by itself make an instrument tradable: the liquidity and volatility checks apply independently, and each strategy also decides which instruments it can trade based partly on its turnover.
Commissions change over time, and realistic estimates are essential for a meaningful backtest. Because the price histories of some instruments extend back to the 1970s, the cost history must include at least reasonable proxies for the broker fees charged at the time. In the 1970s, commissions could be as high as USD 30 per transaction!
I will cover how these settings work together, how to automate rolls efficiently and how to estimate costs for the earlier part of the backtest in a separate article.
Contract quirks
Fred likes the phrase “standardised contracts”. It sounds as though someone has already done the difficult work. He opens the security master expecting a quiet afternoon and finds a petting zoo.
The first animal is 🔥GAS-US-WEEKLY, which expires every Friday7. Fred’s filing system identifies a futures contract only by year and month. This works beautifully until a month contains five Fridays. “Which Friday?” asks Fred. The spreadsheet maintains a dignified silence (see Figure 12). This instrument is blacklisted because the required history is unavailable, but the problem of weekly expiries would remain even if the data became available.
Then comes European natural gas along: It changes its size without asking permission. The contract sizes of Dutch TTF 🔥GAS-W-NL8 and UK NBP 🔥GAS-W-UK9 depend on the number of days in the delivery month, so a March contract is larger than a February contract. TTF also counts the delivery hours, where daylight-saving time occasionally adds or removes an hour.
My solution is to hold only December expiries (hence the suffix ‑W for Winter). December reliably supplies 31 days, giving fixed configured multipliers of 744 MWh for TTF and 31,000 therms for NBP. It is less a triumph of financial engineering than a strategic alliance with the calendar.
Fred is just beginning to admire this solution when ICE announces a minimum trading size of five lots for both products. Ordering one gas contract is not on the menu: The smallest serving feeds a family of five. Fred marks both rows DoNotTrade, stamps the application closed and congratulates himself on another job well done.
Trading on exchanges around the world brings plenty of local peculiarities. Australia is a particularly generous contributor. Until June 2025, ASX cash equities opened in five groups ordered by security code10. Trading started in alphabetical batches: A–B first, C–F next, and everyone from S–Z waiting at the back. ASX now uses a single opening auction, but its bond futures still keep Fred employed.
The Australian bond futures have a fixed face value of AUD 100,000, yet their prices are quoted as 100 minus the annual yield. Consequently, the dollar value of the same yield move varies with the level of interest rates11. The exact conversion is nonlinear.
My system uses a fixed average multiplier instead. This will not win a prize in numerical analysis, but the variation is small enough for the job and Comment records the approximation for the next person who wonders why the multiplier looks suspiciously hand-crafted.
Hong Kong supplied another lesson when I first traded equities there. At noon, the regular morning session ended. I checked the logs, the internet connection, and, briefly, my sanity. Nothing was broken: the afternoon session begins at 1 p.m. Even an electronic market can put up a sign saying, “Back after lunch.”
Finally, expiry schedules can change during the lifetime of an instrument. For 🌾MILLWHEAT, Comment records a cycle change and says that the usable sequence begins with the March 2015 contract, 2015H. The current cycle comprises March, May, September and December12. Unfortunately, a comment is documentation, not an executable instruction. Writing “start here” in a spreadsheet does not make the loader start there, just as Fred’s note saying “please work” does not repair the office printer.
These oddities point to the same engineering rule: a futures identifier is part of the data model, not just a label. If an exception changes prices, position size, trading access or contract selection, the rule belongs in code and tests. Comment should explain the exception, not be the only place where it exists.
Fred adds “standardised” to his list of words that should require supporting evidence.
Key Takeaways
A security master is not a list of things to buy. Of 684 entries, 301 result in tradable instruments, and those represent 243 market exposures. Daily checks can narrow the live universe further.
Backfill and retired rows are historical infrastructure, not clutter. Contract handovers, price units and conversion offsets must all agree before histories can be joined.
Blacklist, DoNotTrade and IsTradable answer different questions: whether to load the history, whether the portfolio may hold the instrument, and whether it passes daily liquidity, volatility and cost tests.
Contract variants earn a place through cheaper execution or position sizing, not by pretending to be independent markets. Group correlated variants before allocating risk to them.
Documentation is essential: it records what is unusual, why an exception exists, and how it should be handled.
Classification system
How instruments become risk buckets.
The security master uses three classification levels. AssetClass divides the universe into seven top-level groups: agriculture, energy, equity, foreign exchange, metals, rates, and volatility. Each class is subdivided at two further levels. The aim is to group instruments by economic exposure. For example, the rates class separates short-term interest rates (STIR) from longer-term bonds (Bonds). The third level usually adds a region or a narrower product family. An equity contract might therefore be classified as Equity / Index / EMEA, and a wheat future as Ags / Grain / Wheat.
This hierarchy supports the risk allocation model. Each top-level group receives the same risk allocation, except volatility, which receives less. The same principle applies at the lower levels. Correlation grouping further reduces the influence of contracts that represent substantially the same market. Together, the instruments in Equity / Index receive the same capital allocation as those in Energy / Coal.
The consequence is easy to miss. Adding a thirtieth equity-index future does not give equities thirty times the risk allocation of a single energy contract. It mainly divides the existing equity allocation into smaller pieces.
Figure 13 shows the number of tradable instruments in each asset class over time. The 150-day average smooths out the effects of local holidays and brief drops in liquidity. The equity class has grown fastest, particularly since 2000. Agriculture and rates have much longer histories but have expanded more slowly. Volatility remains deliberately small.
Some classifications are factual. A Japanese yen future is FX / Developed / ASIA. Others reflect choices about how the portfolio should treat an exposure.
The workbook places crypto futures under Metals / Crypto / None. This does not mean that Bitcoin is a metal. It prevents a still-small group from acquiring its own top-level risk budget merely because it does not fit the traditional labels. The word None at the third level is also intentional: geography adds little to that grouping.
🌐MSCIWORLD is another judgment call. Its benchmark is global, but the workbook assigns it to the US branch because the index is heavily weighted toward US equities.
The labels need not be philosophically perfect. Several classifications can be reasonable. The scheme must be internally consistent and documented, and changes to it must be treated as model changes. Reclassifying an instrument can alter historical group counts, portfolio weights, and any cross-sectional signal built from its peers.
Process automation
Software assembles the work — with a human in the loop.
The annual update begins with three product lists and ends with a revised security master and recalibrated strategies. In between lies the tedious work: finding what has changed, deciding what deserves a closer look, and checking that the resulting data can support research and trading. Automation turns a tour of several hundred spreadsheet rows into a shorter list of decisions. Figure 14 shows the process.
Collect, compare, reconcile
The process starts with three automated steps: retrieving the futures universe from Interactive Brokers, collecting CSI’s product catalog, and obtaining Norgate’s futures symbols. Each source provides a different part of the picture. The broker lists products that may be available to trade. The providers list the histories they cover.
Next comes matching. Automated helpers compare the broker catalog with the symbols already recorded in the security master. They flag new products to configure and existing symbols that no longer appear in the broker’s catalog. Resolving these gaps is still a manual process. The description, exchange, currency, contract size, and settlement terms help establish whether a broker product matches a provider’s history. Similar names are useful clues, but they are not proof.
From candidates to decisions
Once the sources are reconciled, the review proceeds through several filters and proposal lists. The first pass removes products outside the intended scope: single-stock and spot-quoted futures, along with markets the system cannot access. The remaining candidates need usable histories and a way to estimate trading costs.
The next pass revisits earlier exclusions. Has a previously illiquid contract attracted volume? Has a short history become long enough? Is bid/ask data now available? Have measured spreads fallen below the cost estimate that kept the instrument out? The notebook identifies these candidates using provider statistics, stored histories, and collected spreads. Where evidence is missing, the work list may point back to the exchange for a manual liquidity check.
Existing instruments need attention too. Missing broker symbols and sustained zero volume can signal deteriorating access or liquidity. Other reports compare highly correlated contracts and suggest sharing histories across sizes. These proposals need review: units and settlement terms can differ. Using a larger contract’s history also omits the smaller contract’s own volume and open-interest data, which can affect roll decisions.
The review ends with a decision for each candidate: add it, revise its configuration, retain it only for historical research, or leave it excluded. The workbook records the decision and its reason, so next year’s review can question an assumption rather than reconstruct it.
The reports identify candidates — I make the changes. Fred’s REVIEWED stamp is only useful if next year’s reviewer can tell what he checked.
Rebuild, check, repeat
After the workbook changes, the data pipeline reloads the definitions, updates the contract histories, applies migrations and backfills, creates roll calendars, and assembles the back-adjusted series. This is where a plausible spreadsheet row has to produce usable data.
Automated data quality checks support each step, as outlined below. A failure sends the relevant definition or source data back for investigation.
Data quality checks
Spreadsheet: complete, consistent instrument definitions, identifiers, units, and documented exclusions.
Contract data: expected histories and dates, current observations, sensible prices and volumes, and missing data flagged for review.
Migrations and backfills: compatible contracts, correct unit conversions, and joins that preserve the intended exposure.
Roll calendars: contracts available for the configured holding and pricing schedules, including those needed for upcoming rolls and carry calculations.
Back-adjusted series: continuous histories with plausible returns, supported by the required currency data.
Execution feedback: broker access, collected spreads, and execution prices checked for discrepancies that warrant another look.
The updated master then feeds into strategy recalibration. New markets and longer histories can change signal magnitudes and correlations. The system re-estimates forecast scaling and diversification adjustments, then reruns the portfolio backtest after costs and produces a recalibration report.
The annual review revisits the whole universe. Daily automated checks and monitoring may prompt an ad hoc review. A new product or a broker restriction (as in the LME example above) can therefore restart the relevant part of the process. The aim is to make each update smaller and easier to explain, rather than save a year’s surprises for one heroic spreadsheet session.
Key Takeaways
Automated checks flag new products, missing symbols, and changing market conditions for review. Revisit earlier exclusions when the evidence changes.
Contract matching and inclusion decisions still need human judgment.
Validate what the revised workbook produces: contract data, migrations, roll calendars, and back-adjusted histories. Failed checks send the relevant definitions or data back for review.
Conclusion
Small gains, earned the tedious way.
Successful systematic trading depends less on brilliant strategies than on getting a great many dull things right. The security master is part of that work: it keeps the universe used for research connected to the markets available for trading. Neglect it, and a promising backtest may rely on trades you could never have made.
So far, every article in this series has involved grinding out another small improvement. These gains add up. The cumulative result comes from patient attention to details that are easy to overlook and rarely exciting to fix.
The latest security master update raised my backtested Sharpe ratio by 0.1 over the period since the 2008 financial crisis. Much of that improvement came from excluding illiquid instruments and markets I could not trade. Chasing maximum diversification without getting the details right had not helped. Being more selective did.
Uncle Fred surveys the rejected applications, straightens the surviving files, and raises his stamp for a thunderous APPROVED. His contribution to quantitative finance is complete for this year. He has earned a second biscuit. Somewhere outside, a genius is waiting to explain a revolutionary strategy. Fred calls through the door: “Take a number. And bring the paperwork.”
Appendix A: Definitions and Methodology
| Backtesting conventions | |
| Capital and risk target | Results assume no compounding, an initial normalized capital of 1, and a 25% volatility target. The base currency is USD and all prices of futures contracts are converted to their USD value using the respective end-of-day exchange rate. |
| Costs | All performance figures are stated after estimated trading costs unless stated otherwise. |
| Sharpe ratio | Annualized from daily returns, after estimated trading costs, without geometric compounding, and assuming a risk-free rate of 0%. No excess-return adjustment is applied, so the figure is a return-to-risk ratio rather than a risk-premium ratio and is not directly comparable to published Sharpe ratios that subtract a cash rate. |
| Drawdown | Maximum and average drawdown are reported as percentages of capital. Drawdown duration is reported in trading days and measures the time from a peak until that peak is regained. |
| Correlations | Calculated from strategy returns after estimated trading costs. |
| Monthly skewness | Skewness of monthly returns, where a month’s return is the sum of its daily returns without compounding. Computed as the third standardized moment of the monthly distribution (population form, no sample correction). Positive values indicate occasional large gains against many small losses, negative values the reverse. Monthly rather than daily returns are used because daily skewness is dominated by single-day noise. |
| Lower and upper tail | Tail ratios of daily returns after estimated trading costs, with the mean removed. The lower tail is the 1st percentile divided by the 30th percentile, the upper tail the 99th percentile divided by the 70th, each divided by 4.43, the corresponding ratio of a normal distribution. A value of 1 means the tail is as heavy as a normal distribution’s; values above 1 mean fatter tails, values below 1 thinner tails. The ratios are scale-free, so they can be compared across strategies with different volatilities. |
| Data and universe | |
| Instrument | A futures contract on a particular underlying asset. The same asset may be traded as two different instruments — for example two contract sizes on the same underlying, such as mini and micro contracts. |
| Data sources | Daily data for individual futures contracts come from Norgate Data and Commodity Systems Inc. (CSI). Bid/ask quotes used to estimate spread costs come from Interactive Brokers and Databento, subject to market coverage. |
| Tradable universe | Eligibility depends on data quality, liquidity, volatility, estimated costs and the restrictions recorded in the security master. The universe changes over time, for the construction and maintenance of the universe, see Building a Futures Security Master and the accompanying security master. |
| Burn-in | Signal calculations require an initialization period before an instrument becomes eligible to trade. Observations during burn-in are neutral and do not create signals that will be traded on. |
| Liquidity quintiles | Instruments are assigned to quintiles using their most recent 20-day average risk volume in USD. Quintile 1 contains the most liquid instruments. |
| Parameter selection and validation | |
| Strategy family | A strategy family groups strategies with similar behavior. There are currently two families: divergent and convergent. Divergent strategies seek to profit from persistent price movements, while convergent strategies seek to profit from prices reverting toward an equilibrium level. |
| Strategy | Several parameters are combined into an ensemble, which reduces dependence on any one parameter estimate. This ensemble of parameters is called a strategy and also provides some diversification. Each version of the strategy using a particular parameter value (or lookback) is called a strategy variant. |
| Parameter | A parameter refers to a specific lookback period used to calculate a trading signal. |
Appendix B: Research and Publication Conventions
| Research status and limitations | |
| Result status | Unless explicitly stated otherwise, the strategy results presented are based on hypothetical historical simulations and do not represent the results of actual trading. Historical simulation cannot fully reproduce the effects of live execution, liquidity, funding, market impact, capacity constraints, operational events, or changing market structure. |
| Interpretation | Historical performance is used as diagnostic evidence within the research process, not as proof that a strategy will remain profitable. Markets are non-stationary, samples are finite, and estimated relationships may change over time. |
| Trading risk | Futures trading may involve leverage and substantial losses. Diversification and volatility targeting may alter the distribution of risk but do not eliminate the possibility of loss. |
| Research purpose | This article is provided for informational and research purposes only. It does not constitute investment, legal, or tax advice, a recommendation, or an offer or solicitation to buy or sell any financial instrument or strategy. |
| Figures, tables, and sources | |
| Default conventions | Unless a figure or table states otherwise, the definitions, performance conventions, cost assumptions, and calculation methods in the preceding appendix apply throughout the article. Captions therefore state only information needed to interpret the specific exhibit or an exception to the default conventions. |
| Sources and calculations | Unless otherwise stated, market-data sources are those listed in Appendix A. Data transformations, strategy simulations, calculations, tables and figures are produced by Dr. Sebastian Schmidt. References to third-party providers identify the source and do not imply endorsement. |
| Sample periods | The applicable sample period is stated in the surrounding text, figure, or table where necessary. Effective samples may differ across instruments because of inception dates, data availability, liquidity requirements, and burn-in periods. |
| Rounding | Reported values may be rounded for readability. Calculations and comparisons are based on the underlying unrounded values unless stated otherwise. Apparent differences caused solely by rounding are not economically meaningful. |
| Exceptions | Figure- or table-specific notes override these default conventions where they differ. Methodological exceptions that materially affect interpretation are stated with the relevant exhibit. |
| Publication control | |
| Document identification | The publication month, issue number, and author shown on the cover identify the article. A materially revised publication should be issued with an updated date, issue, or version identifier so that the research state can be distinguished from earlier releases. |
| Terminology | Defined terms are used consistently throughout the article. Where a term has a strategy-specific meaning, the definition in the preceding appendix governs unless the text explicitly states otherwise. |
| Reproduction and attribution | Third-party data remain subject to the terms of the respective data providers. Reproduction of article content should preserve relevant source attribution and identify Dr. Sebastian Schmidt as the author of its calculations and research. |
Footnotes
Montréal Exchange, BAX-to-CORRA conversion announcement.↩︎
Rotten Tomatoes, Trading Places (1983).↩︎
CME Group, frozen pork belly futures delisting notice.↩︎
Interactive Brokers, OTC futures on LME metals.↩︎
ICE, London Cocoa Futures specifications and Cocoa Futures specifications.↩︎
Interactive Brokers, 871(m) withholding;↩︎
CME Group, Henry Hub Natural Gas Weekly Futures.↩︎
ASX, Changes to equity market structure—opening and closing the market.↩︎
Euronext, Technical specifications of the Milling Wheat No. 2 Futures contract.↩︎